See every Azure dollar.
Across every subscription.
A global Microsoft CSP partner needed a single source of truth on Azure spend — across Enterprise Agreement, CSP and Direct programs, with per-customer attribution and a refresh cadence finance could actually plan against. Kansoft built the platform on Microsoft's open-source 'peek' Azure Usage and Billing Analytics reference architecture in 2018, then continuously modernised it onto current Azure Cost Management exports, Functions, Data Factory and Power BI.
Three things every growing Azure footprint discovers too late.
When the Azure estate spans EA, CSP and Direct programs, finance and engineering quietly lose the ability to answer the most basic spend questions. None of the three problems below justify a platform on their own — together they make one inevitable.
Three programs, three portals, no comparable view
Enterprise Agreement, CSP, and Direct billing each live in different portals and APIs. There is no unified surface — finance ends up reconciling exports by hand every month, and engineering can't see the whole estate at once.
Cost overruns surface on the invoice
By the time a cost overrun appears in the monthly invoice, the spend that caused it is weeks in the past. The optimisation window has closed before anyone knew it opened.
No clean showback or chargeback
Without attribution per customer, team, tag or project, there is no way to do showback (let alone chargeback). And what you can't attribute, you can't optimise.
A proven Microsoft pattern. Modernised onto current Azure.
The original 2018 build adapted Microsoft's open-source 'peek' Azure Usage and Billing Analytics sample (MIT-licensed). Each stage of that reference pipeline has since been re-engineered onto the services Azure offers today — Cost Management exports, Functions and Data Factory, Azure SQL and ADLS, Power BI.
Extraction
Aggregation
Storage
Insight
The deliverables — and the operating outcomes they produce.
Five concrete deliverables in the platform, and four operating outcomes the CSP partner runs against today.
- Unified multi-subscription view. EA, CSP and Direct spend in one comparable model — the single source of truth that didn't exist before.
- Near-real-time dashboards. Daily-refreshed usage and billing trends, not month-end surprises.
- Showback & chargeback. Cost attributed per customer, team, tag or project — ideal for CSP resale with per-customer markup applied at the model layer.
- Anomaly & optimisation signals. Spend spikes, idle resources and right-sizing opportunities surfaced as actionable signals, not buried in invoices.
- Forecasting & budgets. Growth-aware projections so finance can plan capacity with confidence — not extrapolate from spreadsheets.
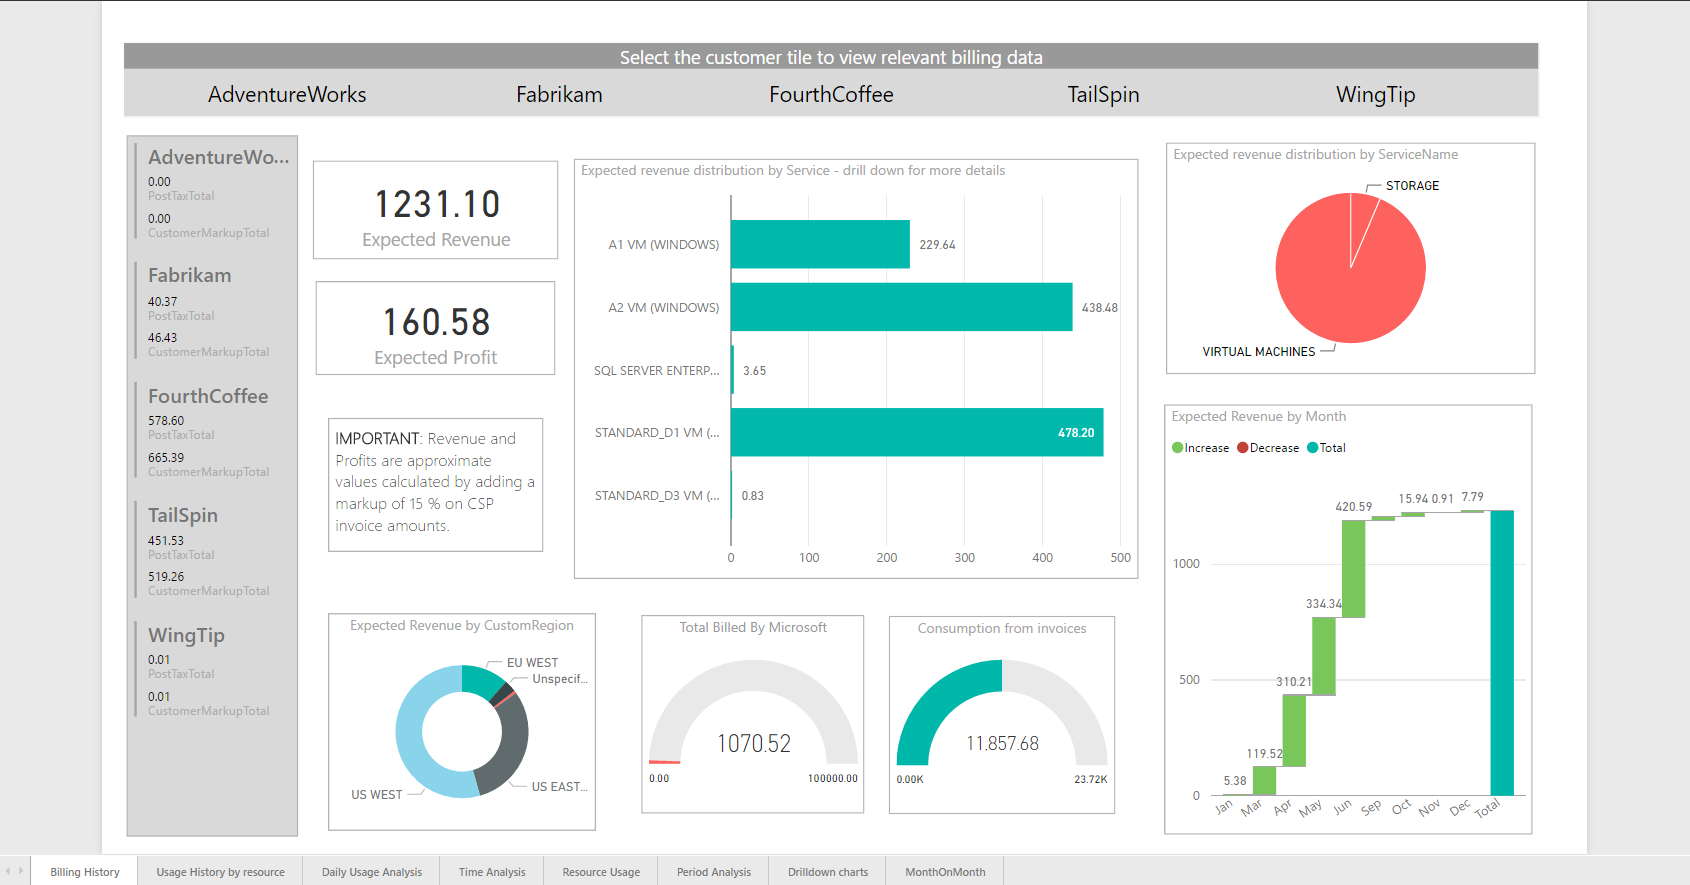
What finance and the CSP team actually see.
Customer-level expected revenue, expected profit, and consumption analytics — built on the unified billing model, refreshed daily, with the configured CSP markup applied at the model layer.
Make Azure spend visible and accountable.
If your Azure footprint spans EA, CSP and Direct — and your finance team is rebuilding the same spreadsheet every month — the calculus has already shifted. We've built this platform once on Microsoft's reference pattern, then modernised it as the Azure services around it evolved. We can do the same for yours.
Speak with our Data & Cloud team