Every engineering leader eventually has the same conversation with finance: you know you need more capacity, you know which model you want — but you have to justify the cost internally. And the moment the dedicated engineering teams cost lands next to a staff augmentation rate card or a fixed project bid, the comparison falls apart, because all three are priced differently and hide their real costs in different places. This is the cost model that closes that gap: what dedicated engineers, staff augmentation, and project-based delivery actually cost over the life of the work — and how to build the financial case your CFO will sign off on.
Why the rate is not the cost
The headline rate is the most visible number in any engineering engagement and the least useful for comparing models. A staff-augmentation rate, a dedicated-team monthly cost, and a fixed project bid are three different units — comparing them directly is like comparing a lease, a salary, and a contractor invoice and asking which is “cheaper.”
What actually decides the cost is total cost of ownership (TCO): the rate plus everything the rate doesn’t show — recruitment, ramp time, the management hours your own team spends, the cost of losing people and the context they hold, and the rework that comes from misaligned ownership. Those costs are real, they’re just invisible on the first invoice. The model that looks cheapest on the rate card is often the most expensive once you account for them.
The three models, defined
To compare cost honestly, the models have to be defined the same way:
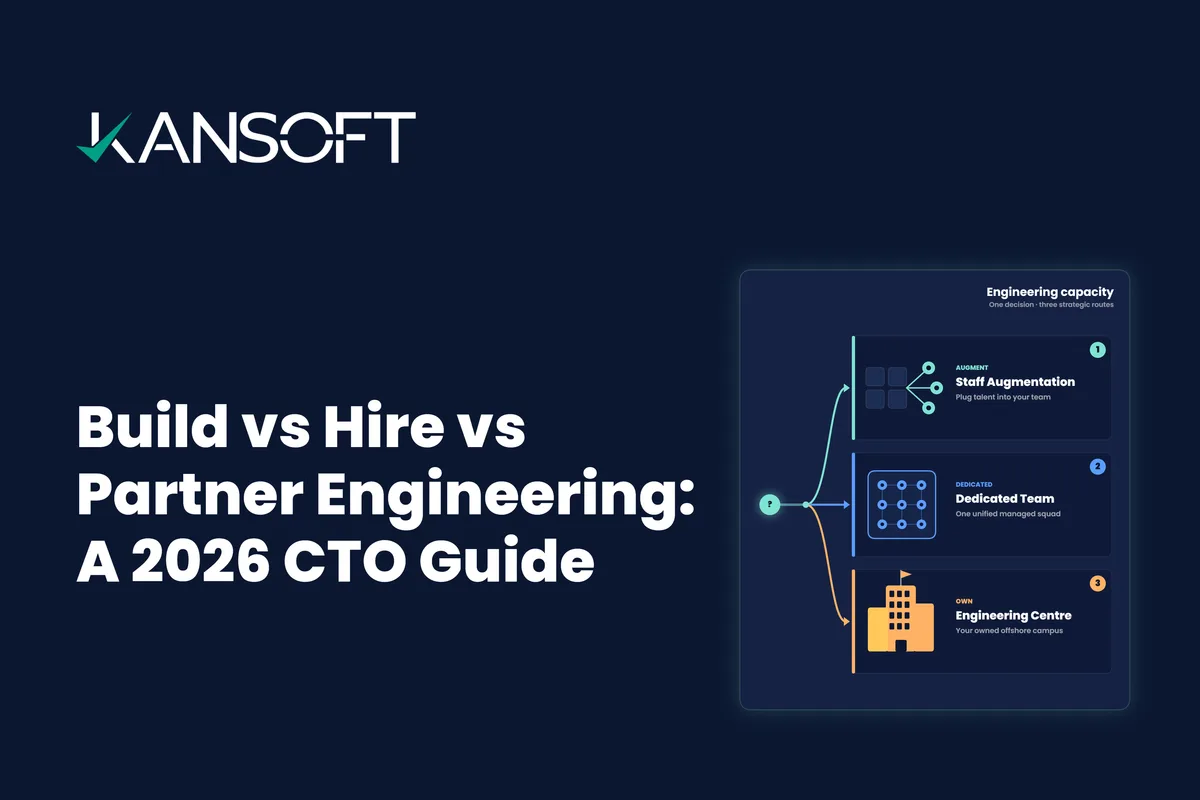
- Dedicated engineering team — a handpicked, cross-functional squad (frontend, backend, QA, DevOps) that operates as your team, aligned to your product over time.
- Staff augmentation — individual engineers embedded into your existing team to fill specific skill gaps, working under your direction and processes.
- Project-based delivery — a fixed-scope engagement priced to a defined deliverable, where the vendor owns and manages the team and hands over the result.
This piece is about which one costs less, and when. If you’re still deciding which model fits your situation — not just what it costs — our build vs hire vs partner guide walks through that decision.
What actually drives the cost
These are the cost components that sit underneath the rate — and they fall unevenly across the three models:
- Recruitment & ramp — finding, vetting, and onboarding engineers before they’re productive.
- Management overhead — your own team’s time spent directing, reviewing, and unblocking the work.
- Continuity & attrition — the cost of a person rolling off and the context leaving with them.
- Knowledge retention — whether what’s learned stays inside a team or walks out the door.
- Scope-change cost — how expensive it is to change direction once work is underway.
- Quality & rework — defects and redo work caused by unclear ownership of the outcome.
- Utilization — whether you pay for idle time between tasks or only for productive capacity.
A model can win on rate and lose badly on these. That’s the gap the comparison below makes visible.
Dedicated teams vs staff augmentation vs project delivery: the cost comparison
| Cost dimension | Dedicated team | Staff augmentation | Project delivery |
|---|---|---|---|
| Pricing model | Monthly cost per engineer / team | Per-engineer rate (often a premium) | Fixed bid per deliverable |
| Recruitment & ramp | Partner absorbs; one team ramp | Partner absorbs; ramp per engineer | Included in the bid |
| Management overhead (your time) | Low — the team is led | High — you direct each engineer | Low — the vendor manages |
| Continuity / attrition cost | Low — the team retains context | Medium–high — context leaves on roll-off | Context lost after handover |
| Scope-change cost | Low — the team re-prioritizes | Low — reassign engineers | High — change orders |
| Quality / rework exposure | Lower — owns the outcome | Varies — you own QA | To spec; gaps surface post-handover |
| Cost predictability | Steady run rate | Scales with headcount | Fixed — until scope changes |
| Lowest total cost when… | Sustained, owned product work | Short, defined skill gaps | Short, fixed, stable scope |
Why duration is the deciding variable
The single biggest factor in which model is cheapest is how long you’ll need the capacity.
- For a short, fixed scope, project delivery is usually the lowest total cost — you pay once for a defined result and carry almost no management or continuity cost.
- For a temporary skill gap measured in weeks, staff augmentation is efficient — you plug in vetted people fast and wind them down cleanly.
- For sustained, owned work measured in quarters and years, a dedicated team wins on total cost, because the ramp is paid once, management overhead stays low, and the context compounds instead of resetting.
The mistake that gets expensive is matching a short-term model to a long-term need — paying a staff-augmentation premium (plus your management time) month after month for what is really permanent capacity.
Build the financial case: a TCO model you can take to finance
Here’s the total cost of ownership (TCO) model to run for each option, over the same time horizon:
TCO = (rate × engineers × duration) + recruitment & ramp + management overhead + continuity/attrition + rework − utilization gains
Fill it in for your own situation:
| Cost line | Dedicated team | Staff augmentation | Project delivery |
|---|---|---|---|
| Rate × engineers × duration | $ — | $ — | fixed bid $ — |
| Recruitment & ramp | $ — | $ — | included |
| Management overhead (your time) | $ — | $ — | $ — |
| Continuity / attrition | $ — | $ — | $ — |
| Rework / quality | $ — | $ — | $ — |
| Your TCO | $ — | $ — | $ — |
To show how the model behaves, here is a worked example.
Illustrative only. The figures below are hypothetical placeholders to show how the model behaves — not benchmarks, averages, or Kansoft quotes. Replace them with your own rates and timelines. The point is the shape of the cost, not the numbers.
Say you need 3 engineers for 18 months of ongoing product work:
| Cost line (illustrative) | Dedicated team | Staff augmentation | Project delivery |
|---|---|---|---|
| Engineer cost | $4,000/eng/mo × 3 × 18 = $216,000 | $5,000/eng/mo × 3 × 18 = $270,000 | Fixed bid $235,000 |
| Your management overhead | ~$10,000 (light) | ~$40,000 (you direct them) | ~$8,000 (vendor-led) |
| Continuity / attrition | Low | ~$15,000 (roll-off & re-ramp) | n/a within scope |
| Scope-change cost (stable scope) | — | — | — |
| Illustrative TCO | ~$226,000 | ~$325,000 | ~$243,000 |
In this hypothetical, the dedicated team and project delivery land close on stable, well-defined scope — but the moment requirements shift (say a 15% scope change adds ~$35,000 in change orders), project delivery climbs above the dedicated team, and staff augmentation stays the most expensive throughout because of the rate premium and your management time. That pattern — not the exact figures — is what to take to finance: for sustained work where scope evolves, the dedicated engineering teams cost is usually the lowest once the full model is counted.
Need engineering capacity without the hiring queue?
See how a dedicated engineering team contributes from week one — and model the cost against your roadmap.
When each model is the cheaper choice
- Dedicated engineering team — sustained, owned product work over quarters or years, where continuity and low management overhead compound in your favor.
- Staff augmentation — a defined skill gap or extra throughput for a bounded period, on a roadmap you already manage.
- Project-based delivery — a short, fixed, well-specified deliverable with stable requirements and a clean handover.
Run all three through the same TCO model over the same horizon, and the cheapest option on the rate card rarely stays the cheapest on total cost.
Want help modelling the cost for your roadmap?
Talk to our team and we'll build the comparison with your numbers.